year
2026
Role
UX and Service Design Lead, Discovery
timeframe
April 2026 to present
tools
Miro, Figma, Microsoft Teams, SurveyMonkey, Excel, GA4, Jira
Battery Park City Authority is the New York State public benefit corporation that manages Battery Park City, a 92-acre neighborhood in Lower Manhattan with parks, public art, memorials and resiliency infrastructure. Its website had grown piece by piece: a WordPress site, a separate resiliency microsite, and a publishing workflow that ran through a single team. In our workshops, staff called it a Frankenstein.
Working with the digital agency Blenderbox, I led UX research, facilitation and information architecture for the discovery phase: the evidence and structure the redesign is built on.
THE WORK, IN SEVEN MOVES
From five workshops to a system engineering can build
Discovery for a public authority is not a research phase that ends in a deck. It is the structure, the content rules and the ownership model that design and build inherit. Here is how I ran it, in the order it happened.
764
pages crawled and audited
5
service blueprint workshops
8 to 6
primary navigation sections
82
content records with an owner
01 · STAKEHOLDER WORKSHOPS
Listening before designing
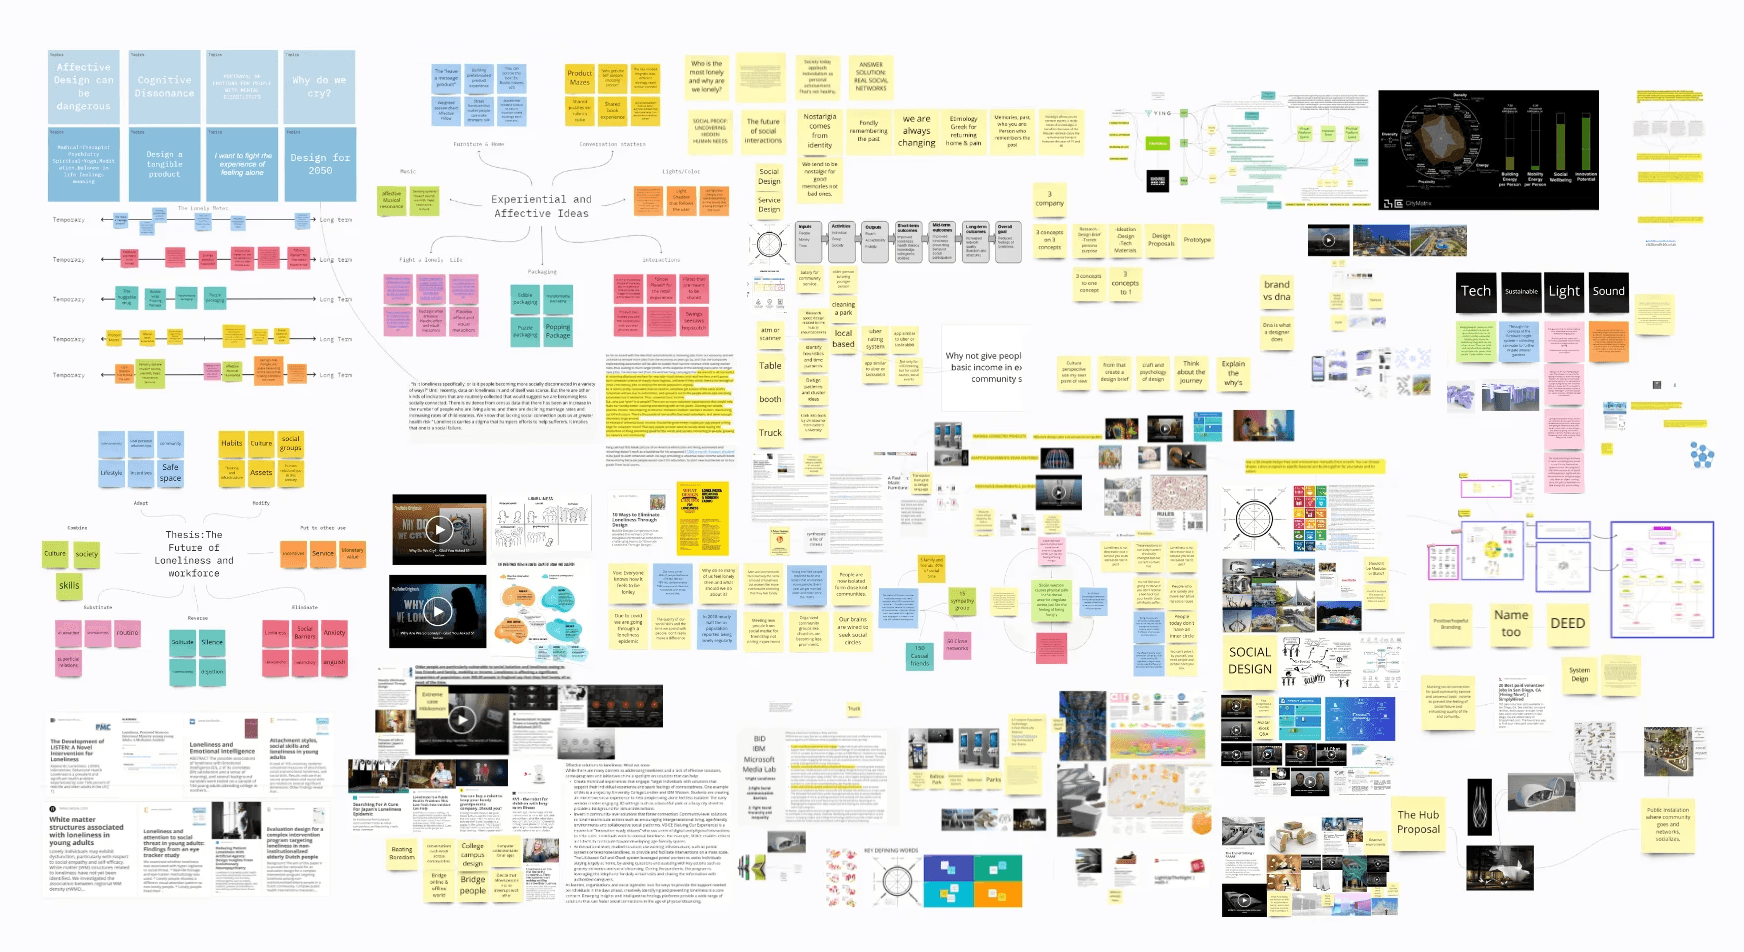
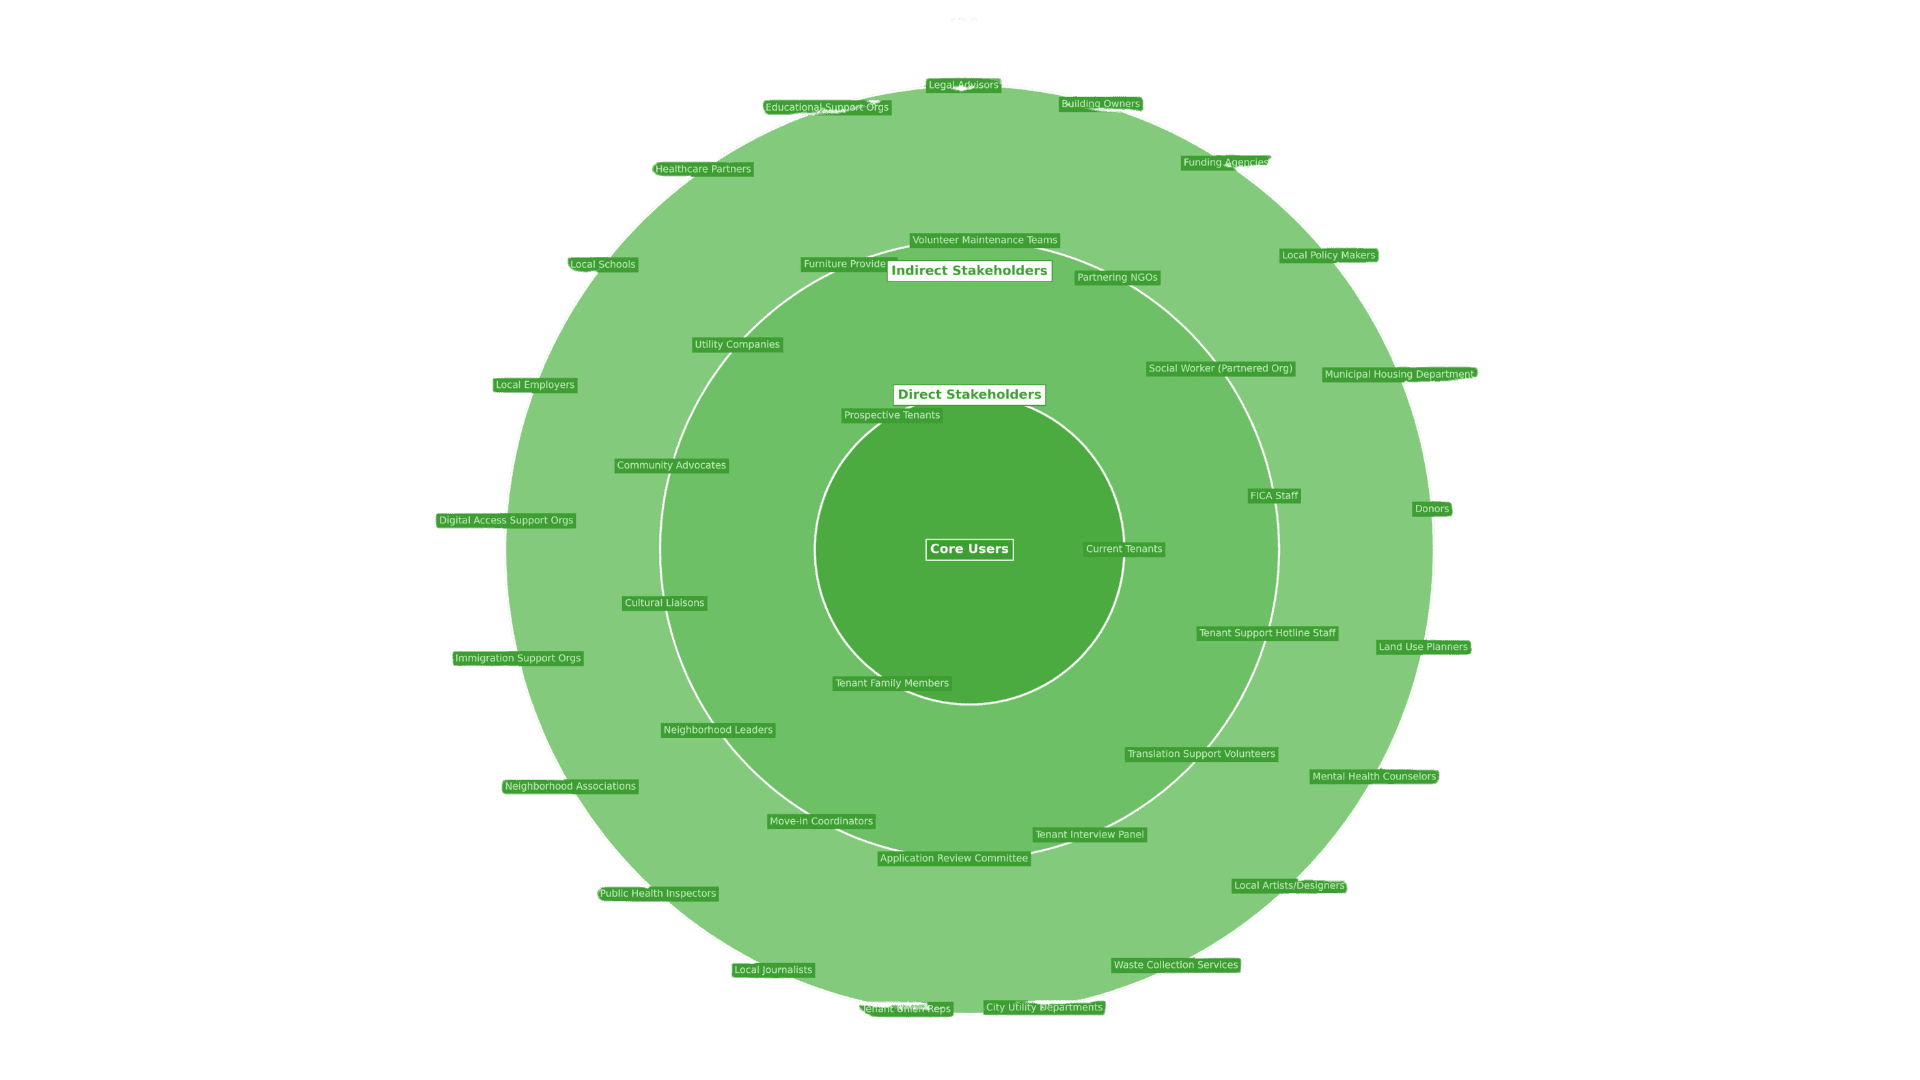
Two cross-department kickoff workshops opened with one question: who is this site for? I pre-filled Miro boards with sourced findings so fifteen departments could validate and correct instead of guessing from a blank canvas. When key stakeholders missed a live session, I rewrote every activity as async prompts so their input still counted. Residents and vendors came out of both sessions as the audiences the site most has to serve.
FROM THE WORKSHOPS
“We’re different departments doing the same thing, but in different spaces.”
Participant, cross-department workshop
WHAT IT CHANGED
Five departments described the same work in different words. The workshops got them into one room and one vocabulary, which is what made a single agreed sitemap possible two months later.

DELIVERABLE
Workshop proposals, facilitator scripts and Miro boards
02 · SERVICE BLUEPRINTS
Mapping the work behind the website
I designed and facilitated five blueprint workshops, each built on one real scenario: a resident request, a vendor chasing an RFP, a permit application, a resiliency update and a seasonal program. Putting front stage and back stage side by side showed that most pain points were operational, not visual: approvals by email, no role-based permissions, publishing bottlenecked through one team. Coding the sessions produced fourteen recurring themes and the four redesign priorities the rest of the work is built on.
FROM THE WORKSHOPS
“Most people that go online to try and do something don’t want a phone call. That’s why they went online in the first place.”
Participant, service blueprint workshop
WHAT IT CHANGED
Every blueprint ended the same way: a phone call or an inbox. I mapped those handoffs as the failure points, so the site answers the question before it becomes a call.

DELIVERABLE
Service Blueprint Workshop Findings Report, five blueprints
03 · CONTENT AUDIT AND ANALYTICS
Letting the evidence set the brief
In parallel I crawled and audited a 764-page working set and read a year of GA4. 89% of sessions started on an interior page and 42% of use was on mobile, so every page had to work as a front door. The audit found 57,531 PDF downloads in a year with no file-name tracking, 510 event records maintained by hand for 38 recurring series, roughly 155 uncontrolled calendar tags, 744 site searches in twelve months and no key events configured at all, so the site could not report whether anyone ever finished a task.
FROM THE WORKSHOPS
“I don’t think anybody’s searching anything on our website from a procurement perspective.”
Participant, procurement blueprint
WHAT IT CHANGED
A fair assumption, and the audit tested it rather than took it. Doing business with BPCA was ranked a top three audience in both stakeholder workshops, so procurement came out of the generic Apply bucket and became its own section.

DELIVERABLE
Live Website Content Inventory and three analytics reports
04 · SITEMAP
From eight sections to six
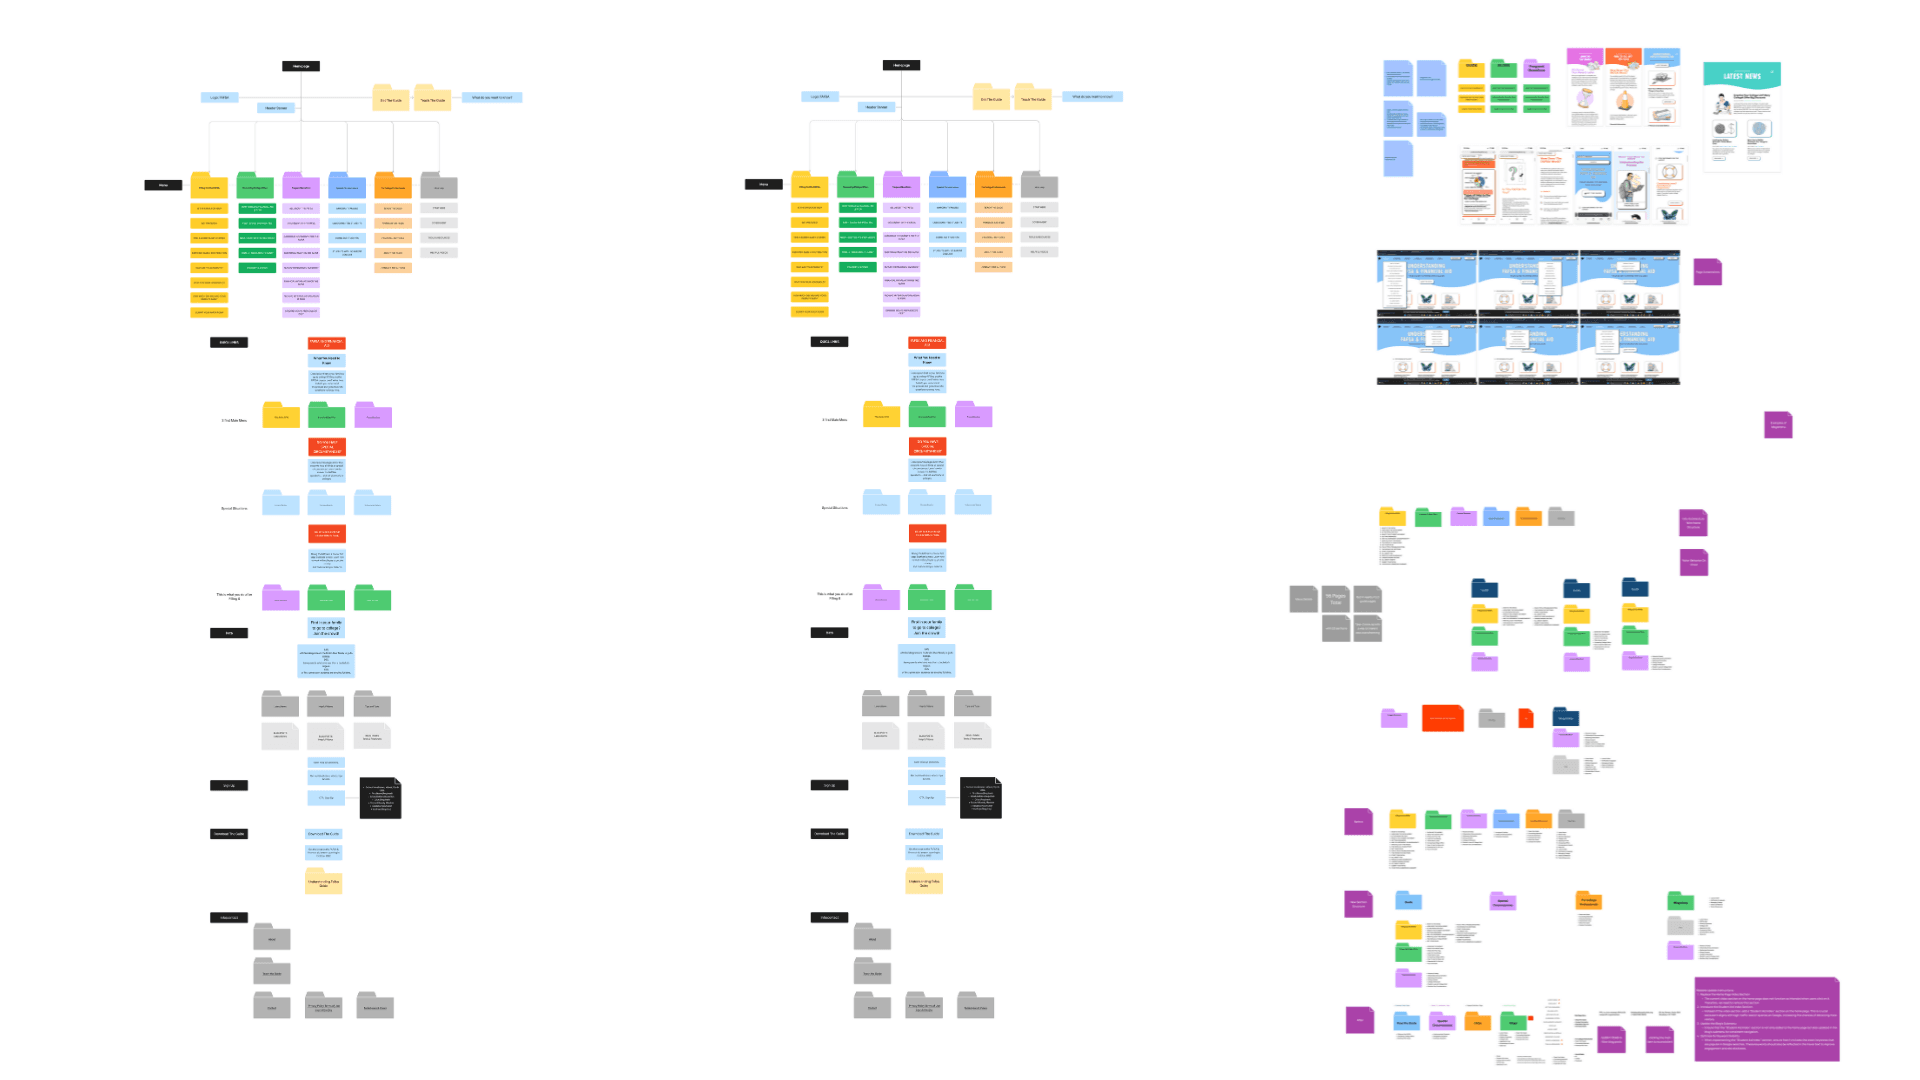
Each of the six primary sections now owns one audience question. Permits moved out of a generic Apply bucket into Events and Programs, where the need begins. Procurement became Doing Business with BPCA, the only audience ranked top three in both stakeholder workshops. Visit became Explore Battery Park City. The standalone resiliency microsite folds in as a dedicated BPC Resiliency section, with redirects that protect an audience that already trusts it. Contact, About, Procurement and Careers moved to a persistent utility layer.
FROM THE WORKSHOPS
“It’s our project, a public project. No reason it should be apart from our other work.”
Participant, resiliency blueprint, on the separate microsite
WHAT IT CHANGED
The resiliency work lived on its own microsite, separate from everything else BPCA does. It folds into the main sitemap as a dedicated section, with redirects that protect the audience already using it.

⤢ Preview the Figma board
DELIVERABLE
Current and Recommended Sitemap
05 · GOVERNANCE AND MIGRATION
Designing who keeps it accurate
A public website only stays accurate if someone owns each page and the workflow matches how fast it changes. Of 82 governance records, 51 change rarely, so a single publishing workflow was never going to hold. I proposed four, with service owners accountable for accuracy, Communications for editorial standards and platform administration for access and technical health.
FROM THE WORKSHOPS
“No one on our staff is a trained webmaster. It was YouTube for me.”
Participant, service blueprint workshop
WHAT IT CHANGED
If nobody is trained, the system has to carry the training. The governance model names a service owner for accuracy, Communications for editorial standards, and platform administration for access, with review cadences matched to how fast each kind of content actually changes.

DELIVERABLE
Content Governance and Migration workbook
06 · WIREFRAMES AND UI
Annotated templates, not pretty pictures
Rather than a page-by-page mockup set, I delivered five annotated sample experiences in Figma: reporting an issue, Visit, Procurement, the permit guide and BPC Resiliency. Each one demonstrates a different UX principle, and each annotation names a content rule, a CMS field or a permission, so the templates double as requirements. Design continues as an iterative process with BPCA.
FROM THE CLIENT REVIEW
“Community is not descriptive enough.”
BPCA feedback, sitemap review
WHAT IT CHANGED
Section names went back to BPCA instead of being assumed. Community became Living and Working in BPC, and every other label went through the same round of review.

⤢ Preview the Figma board
DELIVERABLE
Five annotated sample wireframes in Figma
07 · DEV HANDOFF
Handing engineering a system, not a stack of screens
What goes to the build is the structure discovery produced: CMS requirements built around roles, approvals and structured fields, the migration plan and redirect map, and an inventory of every form and integration that needs a decision before it is rebuilt. Each item traces to a workshop, the audit or the workbook, so engineering can ask why and get an answer.
FROM THE WORKSHOPS
“Our website is currently two websites that were merged together.”
Participant, service blueprint workshop
WHAT IT CHANGED
That is why the handoff leads with structure instead of screens. Content types, roles and approvals, a migration plan and a redirect map, so engineering inherits one system rather than the seam between two.

DELIVERABLE
CMS requirements, migration plan and redirect map
ON CLIENT CONFIDENTIALITY
The Discovery Report is published in full further down this page. The working files behind it stay with the client: the content inventory, the governance and migration workbook, the CMS requirements and the annotated wireframes. I can walk you through those in a meeting on request.
WHAT THE STRUCTURE BECAME
The design it fed
After the workshops and the research, this is where the structure became screens. I worked alongside Cindy, the UI designer, as the UX designer on the project: the order things appear in, the features each page needed, and the logic holding the new site together. She designed the interface. I defined what went on it and why.
THE NAVIGATION, AS BUILT
Six sections, and what sits under each
These two menus are the recommended sitemap made visible. Eight primary sections became six, and everything that used to live in the navigation either moved under one of them or went to utility.

Events and Programs, expanded
What’s happening, finding an event, and the programs underneath.
⤢ Preview the Figma board

What We Are Building, expanded
BPC Resiliency, folded into the main site rather than living on its own domain.
ONE TEMPLATE, THREE CATEGORIES
The same place page, three kinds of place
Public art, parks and public spaces, and museums and memorials all run on one template and one content model. The category changes the colour and which fields appear, not the structure underneath.

Public art
The Real World, Tom Otterness.

Parks and public spaces
The Esplanade.

Museums and memorials
Berlin Wall Segment, Kowsky Plaza.
WHERE THE STRUCTURE PAYS OFF
Two places it does real work

Construction impacts, mapped
Tree removals and replanting as a map plus a set of questions, inside the resiliency section.

The history gallery
Images handled as records with captions and dates, instead of a PDF of scans.
THE DELIVERABLE ITSELF
The Discovery Report, in full
Forty-eight pages: the executive summary, the kickoff and service blueprint workshops, site analytics, the user survey, content governance and migration, redesign priorities, the information architecture and proposed sitemap, the UX approach and sample wireframes, the brand and design foundation, the technical approach, open questions and the roadmap. Scroll inside the frame to read it.


Battery Park City Authority Discovery Report, August 2026. Produced with Blenderbox. Published here with the client branding intact.
THE DELIVERABLES
What discovery delivered
Everything below was produced during the discovery phase and handed to Blenderbox and the Authority. The documents themselves are client material and stay private. Summaries, redacted extracts and walkthroughs are available on request.
01
Discovery Report
The master document: findings, four redesign priorities, both sitemaps, the governance model and five sample wireframes. Delivered with a client presentation deck.
02
Current and Recommended Sitemap
Side-by-side working document taking primary navigation from eight sections to six, with a utility layer and the resiliency microsite folded in.
03
Content Governance and Migration workbook
82 sections, 171 news pages, 510 event records across 38 recurring series, 40 plugins and 14 third-party services, each with an owner and a migration treatment.
04
Live Website Content Inventory
A 764-page working set audited section by section, flagging duplicates, out-of-date pages and content unreachable from any menu.
05
Service Blueprint Workshop Findings Report
Five blueprints covering resident requests, procurement, permits, resiliency and events, coded into fourteen recurring themes.
06
Site analytics reports
Three reports: what people come for, how they arrive, and what to build. The evidence base for the IA and template decisions.
07
Technical review and audit
Platform, performance and accessibility baseline for the existing WordPress site and the resiliency microsite.
08
Sample wireframes
Five annotated experiences in Figma, each annotation naming a content rule, a CMS field or a permission.
What I took from it. Service design inside a public authority is mostly the work of making ownership visible. The sitemap was the easy part. The hard part was getting fifteen departments to agree on who answers for each page, and then designing a system that respects that answer.